 Best Practices
Measure load speeds with Google PageSpeed Insights
Load speeds for your website are an important metric to be aware of. The most obvious impact of a slow site is frustrated users – especially on mobile devices. However, it can also create a technical debt that can be difficult to overcome. Search engine crawlers aren’t going to wait around for your site to load so they can crawl and index it. That will indirectly impact your SEO ranking and could lead to less organic traffic over time.
Be aware of site load speeds
There are two free tools from Google that can tell you about your site’s load speeds: Google Analytics and Google PageSpeed Insights. I like to start in Google Analytics, because you can see aggregate data over time for each and every page of your site. It might be that you have a fast home page, but a very slow blog archive. Google Analytics will also link directly to PageSpeed Insights suggestions.
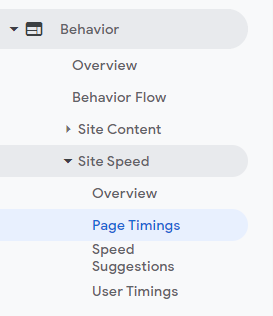
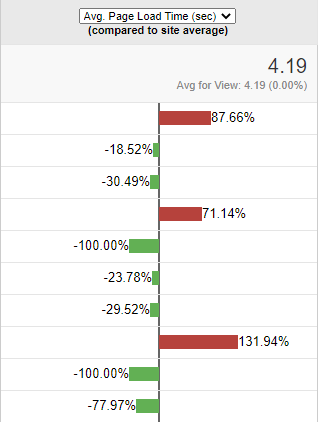
Navigate using the left-hand main menu to Behavior > Site Speed > Page Timings. Here you can look for any problem child in your entire site and start your focus there. First, the average load time for all pages is show at the top of the chart. Then each page is assigned a bar chart for its deviation from the average. The red bars show the slower page and what percentage above average they took to load. This is accumulated for all users over a period of time, so may not perfectly represent a single load experience you may have had.
Get more detailed data on load speeds
The menu item just after “Page Timings” is “Speed Suggestions.” If you’ve determined that you have a page with a load speed problem, this is the next place to go to view suggestions. The link for suggestions will actually take you to a new window loaded with PageSpeed Insights. So you could skip right to there from the beginning if you already know you have some slow pages. Here you will see more detailed information about some timing measurements.
- First Contentful Paint (FCP) – how long it takes your site to go from a blank screen to the user seeing something
- First Input Delay (FID) – any delay between a user interacting with an element, say clicking a button, and the page being ready to respond
- Largest Contentful Paint (LCP) – basically how long it takes your site to look good and as if its finished loading (even if maybe it’s still doing some work in the background)
- Cumulative Layout Shift (CLS) – how much do items move around on the page as they are being loaded
There may be no problems with the perception of your load speed, and often times, perception is reality. Take a look at these advanced measurements and look forward to another blog describing some common problems and things you can do to speed things up!